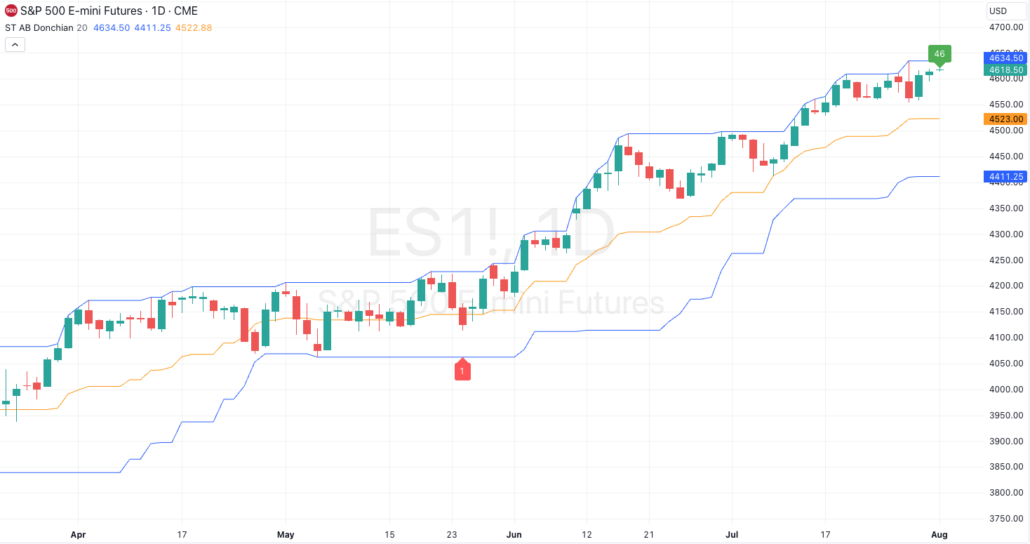
ScalpTrader Bars Above/Below Donchian Channel indicator provides a visualization of the Donchian Channel and measures the number of bars above and below the middle line of the channel.
The Donchian Channel is a trading indicator that outlines the highest high and the lowest low over a defined number of periods, in this case set by the variable “length”. This indicator script specifically also calculates the ‘basis’, which is the average of the upper and lower channels of the Donchian Channel.
When the closing price of a bar is above the ‘basis’, the script increases a counter for “aboveCount” and adds a label on the chart to show how many bars have closed above the ‘basis’. This label is green and it’s always placed at the high price of the bar. Conversely, when the closing price is below the ‘basis’, it increases a counter for “belowCount” and adds a red label on the chart to show how many bars have closed below the ‘basis’. This label is placed at the lower_channel level.
This script can be useful for traders who use the Donchian Channel as a part of their trading strategy. The number of bars closing above or below the ‘basis’ can provide insights into the ongoing trend. A higher count of bars closing above the ‘basis’ can be interpreted as a bullish signal, suggesting an upward trend. Similarly, a higher count of bars closing below the ‘basis’ can be interpreted as a bearish signal, suggesting a downward trend
